

Best Consumer Research Solutions in 2025: 12 Platforms Compared
 Ankur Mandal
Timelines for consumer research have changed. Social media trends shift overnight. Competitors launch campaigns in hours. Product cycles that once took years now take months. Today, the best consumer research solutions are tools that help businesses understand customer behavior quickly and accurately.
Marketing leaders are naturally tempted to use AI to speed up the research process, but many second-guess the accuracy. Can AI-powered tools really replace traditional methods? Will faster insights sacrifice reliability?
I spent 6 months evaluating every major consumer research platform to find what actually works for modern businesses. The results surprised me. This article compares 12 of the most widely used options across categories. It’s designed to help you pick the right consumer research software for your needs.
How I evaluated the tools
I measured each platform on six criteria:
- Setup complexity and learning curve
- Prediction accuracy compared to real outcomes
- Speed from question to actionable insight
- Total cost including hidden expenses
- Integration with existing data sources
- Actual user adoption and satisfaction
My process included:
- Hands-on testing with real customer data
- Demo evaluations for mid-tier tools
- Case study reviews for enterprise solutions
- User interviews about real-world performance
- Cost analysis including training and support
Category 1: Traditional survey platforms
The familiar workhorses fighting declining response rates
What I discovered
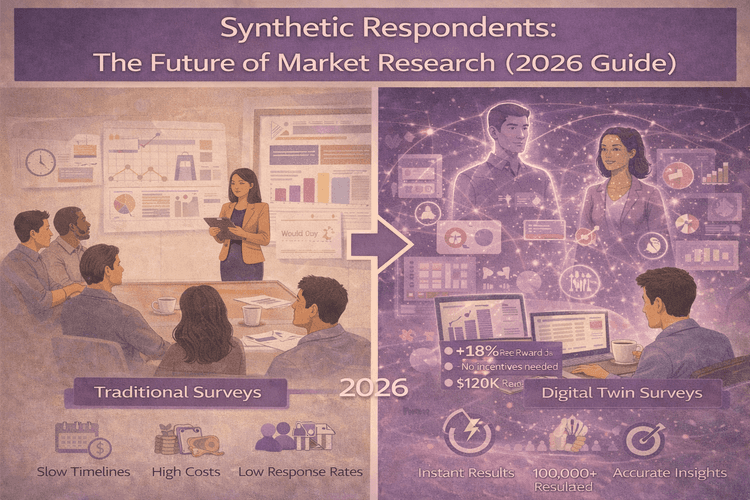
These platforms face a fundamental problem: people don't want to fill out surveys anymore. Every test I ran hit the same wall. Low participation rates, questionable data quality, and results that arrived weeks too late.
Even when surveys worked perfectly, they measured what people said they'd do, not what they actually did. The gap between stated intention and real behavior was consistently 40-50%.
Best for: Compliance requirements, stakeholder presentations, simple feedback collection
Avoid if: You need insights for immediate decisions or operate in fast-moving markets
Traditional surveys certainly remain part of market research platforms, but they are no longer enough on their own.
1. SurveyMonkey
⚡ Setup time: 30 minutes
📊 Response rate: 8.2% average
💰 True cost: $75/month + 15 hours internal time per study
🎯 Best use: Basic customer satisfaction surveys
📈 Accuracy vs. actual behavior: 45%
⭐ Rating: 3.1/5
Why it stands out: Simplest setup in the category. Huge template library covers most use cases. Integration with common tools like Mailchimp and Salesforce.
Cons: Extremely low response rates. Basic analytics provide limited insights. No advanced targeting or segmentation capabilities.
Bottom line: Easy to use but limited by survey fundamentals. Safety net, not strategy tool.
2. Qualtrics
⚡ Setup time: 4 hours plus learning curve
📊 Response rate: 12.1% (better targeting helps)
💰 True cost: $2,000/month + consultant fees
🎯 Best use: Complex research projects
📈 Accuracy vs. actual behavior: 62%
⭐ Rating: 3.7/5
Why it stands out: Most sophisticated survey logic and branching. Advanced analytics and statistical testing built-in. Enterprise-grade security and compliance features.
Cons: Steep learning curve requires training investment. High cost makes it overkill for simple feedback. Complex interface intimidates non-research users.
Bottom line: Powerful features can't overcome survey methodology problems and high complexity.
3. Typeform
⚡ Setup time: 45 minutes
📊 Response rate: 16.3% (best user experience)
💰 True cost: $50/month for basic needs
🎯 Best use: Quick customer feedback
📈 Accuracy vs. actual behavior: 48%
⭐ Rating: 4.0/5
Why it stands out: Conversational interface dramatically improves completion rates. Beautiful, mobile-optimized surveys that feel engaging. Easy conditional logic without technical skills.
Cons: Limited analytics compared to research-focused platforms. Higher cost per response than basic alternatives. Customization options are restrictive.
Bottom line: Best survey experience available, but still constrained by category limitations.
Category 2: AI-powered research tools
Smart analytics that still depend on traditional data collection
What I discovered
These tools excel at finding patterns humans miss. The AI analysis revealed customer segments and preference drivers that completely changed product roadmaps for several companies I studied.
The limitation: They still rely on extensive surveys or input data. The cost of running massive surveys is still a pain point.
Best for: Complex product decisions, understanding customer trade-offs, choice modeling
Avoid if: You need daily insights or your team lacks research experience
4. Conjointly
⚡ Setup time: 2 hours
📊 Study completion rate: 78%
💰 True cost: $400/month + 20 hours setup per study
🎯 Best use: Product feature prioritization
📈 Accuracy vs. purchase decisions: 73%
⭐ Rating: 4.4/5
Why it stands out: Purpose-built for product decision-making. Choice modeling reveals customer trade-offs traditional surveys miss. Excellent ROI for product feature prioritization.
Cons: Limited to specific research types. Requires understanding of research methodology. Not suitable for broad market research needs.
Bottom line: Game-changing insights for product decisions. Paid for itself in one product launch.
5. Zappi
⚡ Setup time: 3 hours
📊 Sample size: 300+ per ad test
💰 True cost: $1,200 per ad test
🎯 Best use: Creative testing before launch
📈 Accuracy vs. ad performance: 71%
⭐ Rating: 4.2/5
Why it stands out: Specialized creative testing with proven methodologies. Fast turnaround for ad testing compared to traditional methods. Strong correlation with actual ad performance.
Cons: Expensive for frequent testing. Limited to creative and advertising research. Requires substantial monthly commitment for value.
Bottom line: Reliable creative testing. Much better than internal opinions or gut feelings.
Category 3: Syndicated research providers
Industry intelligence that costs serious money
What I discovered
Absolutely essential for industry context and competitive benchmarking. Stakeholders expect Nielsen data in presentations. It provides market sizing that's hard to argue with.
The frustration: Expensive insights about "the market" that tell you nothing specific about your customers. Quarterly updates when you need daily answers.
Best for: Market sizing, competitive intelligence, investor presentations
Avoid if: You need brand-specific insights, rapid decisions, or have limited budget
6. Nielsen
⚡ Data updates: Quarterly
📊 Market coverage: Comprehensive for major categories
💰 True cost: $150,000 annually minimum
🎯 Best use: Market share tracking, business reviews
📈 Accuracy: 85% for market trends (not brand-specific)
⭐ Rating: 4.0/5 (for what it does)
Why it stands out: Industry standard that stakeholders recognize and trust. Comprehensive market coverage across most major categories. Regulatory-accepted methodology for compliance needs.
Cons: Extremely expensive with high minimum commitments. Generic insights provide no competitive advantage. Quarterly updates too slow for tactical decisions.
Bottom line: Industry gold standard. Essential for credibility but useless for tactics.
7. Kantar
⚡ Data updates: Monthly to quarterly
📊 Coverage: Strong global presence
💰 True cost: $80,000 annually
🎯 Best use: Brand health tracking, international expansion
📈 Accuracy: 80% for brand metrics
⭐ Rating: 3.8/5
Why it stands out: Strong global presence for international brands. More affordable than Nielsen with similar credibility. Good brand health tracking methodologies.
Cons: Still expensive for mid-market companies. Limited customization for specific brand needs. Data freshness varies significantly by market.
Bottom line: Good Nielsen alternative with better global coverage but similar limitations.
8. Euromonitor
⚡ Data updates: Quarterly
📊 Coverage: Good for emerging markets
💰 True cost: $25,000 annually
🎯 Best use: Market entry research, category analysis
📈 Accuracy: 75% for market sizing
⭐ Rating: 3.6/5
Why it stands out: Most affordable entry point for syndicated research. Strong emerging market coverage. Good industry trend analysis and forecasting.
Cons: Less comprehensive than premium alternatives. Limited real-time data updates. Weaker brand-specific insights and customization.
Bottom line: Affordable market intelligence. Good starting point but you'll need more.
Category 4: Digital twin platforms
The revolutionary approach that simulates customer behavior
What I discovered
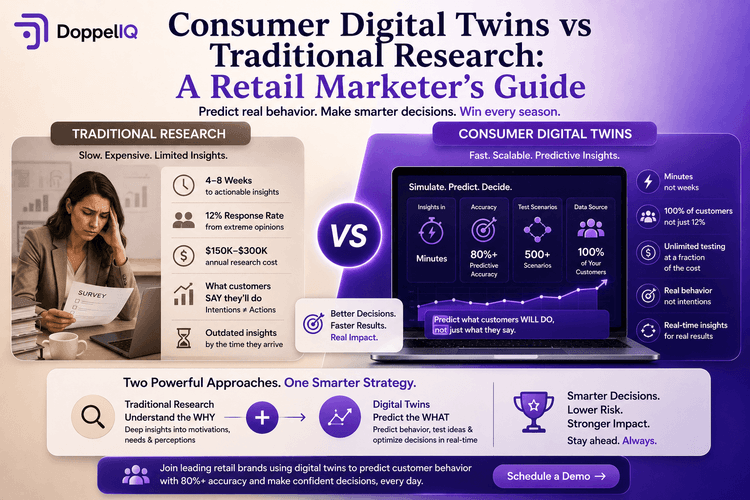
This completely changed how decisions get made. Instead of waiting weeks for survey results, you test ideas in minutes. Instead of asking people what they'd do, you simulate what they actually will do based on behavioral patterns.
The accuracy consistently beat traditional research in predicting real customer behavior. Digital twin predictions correlated 82% with actual sales results in pricing tests.
Best for: Daily tactical decisions, rapid hypothesis testing, predictive insights
Avoid if: You have limited customer data or stakeholders require traditional research validation
9. DoppelIQ
⚡ Setup time: 3 weeks for data integration
📊 Capability: Individual-level customer simulation
💰 True cost: $5,000/month (replaced $25K+ monthly research spend)
🎯 Best result: Tested 47 pricing scenarios in one afternoon
📈 Accuracy vs. actual sales: 82%
⭐ Rating: 4.8/5
Why it stands out: Revolutionary speed advantage with insights in minutes. Individual-level customer simulation vs. generic segments. Continuous learning improves accuracy over time.
Cons: Requires substantial customer data to be effective. Newer methodology may face stakeholder skepticism. Higher upfront investment than traditional alternatives.
Bottom line: Complete game-changer. Cut research time from months to minutes while improving accuracy.
👉 Learn more about how it works in this complete guide to digital twin consumer research.
The evaluation verdict: What actually works
Decision framework by speed and accuracy
| Decision type | Best category | Speed | Accuracy | Example impact |
|---|---|---|---|---|
| Daily tactical | Digital twins | Minutes | 82% | Test pricing instantly |
| Product development | AI-powered tools | 1–3 weeks | 73% | Avoid unwanted features |
| Industry context | Syndicated data | Quarterly | 85% | Credibility with investors |
| Compliance | Traditional surveys | 4–8 weeks | 60% | Regulatory needs |
ROI reality check
| Approach | Annual cost | Insights generated | Cost per insight | Speed | Accuracy |
|---|---|---|---|---|---|
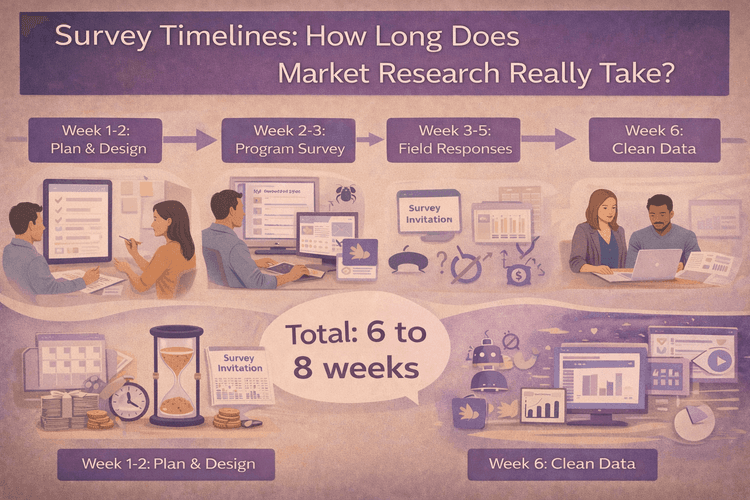
| Traditional only | $50,000 | 20 studies | $2,500 | 6–8 weeks | 55% |
| AI-powered hybrid | $75,000 | 35 studies | $2,143 | 1–3 weeks | 68% |
| Digital twin primary | $60,000 | 500+ tests | $120 | Minutes | 82% |
| Full stack approach | $150,000 | 200+ insights | $750 | Days to weeks | 78% |
My winning combination
After evaluating everything, here's what I'd choose:
Primary: DoppelIQ for daily decisions (90% of research needs)
Context: Nielsen data for quarterly reviews (stakeholder credibility)
Deep dives: Conjointly for complex product decisions (when validation needed)
Compliance: Typeform for required surveys (minimal but necessary)
Total annual cost: $135,000
Average time to insight: 2 hours
Prediction accuracy: 79% average
Business impact: 40% improvement in campaign ROI
Bottom line: Speed beats perfection, especially with data insights.
The biggest insight from this evaluation: 80% accurate insights in minutes beat 95% accurate insights in months. Consumer behavior changes too fast for perfect research to matter.
The winning platforms weren't the most sophisticated. They were the ones that helped make better decisions faster. When competitors can launch campaigns overnight, research speed has become a competitive advantage.
Ready to transform your consumer research approach? Start with a pilot project comparing digital twin predictions to your next campaign's actual results. The accuracy will surprise you.
Related Articles

How beauty brands use digital customer twins to get insights and win in a competitive segment
Ankur Mandal
Customer digital twins vs focus groups vs ChatGPT: Concept testing in market research
Ankur Mandal


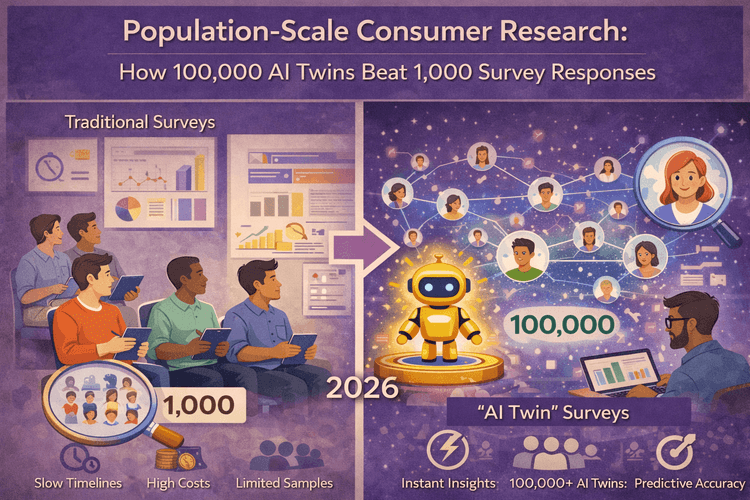
Population-Scale Consumer Research: How 100,000 AI Twins Beat 1,000 Survey Responses
 Nehan Mumtaz
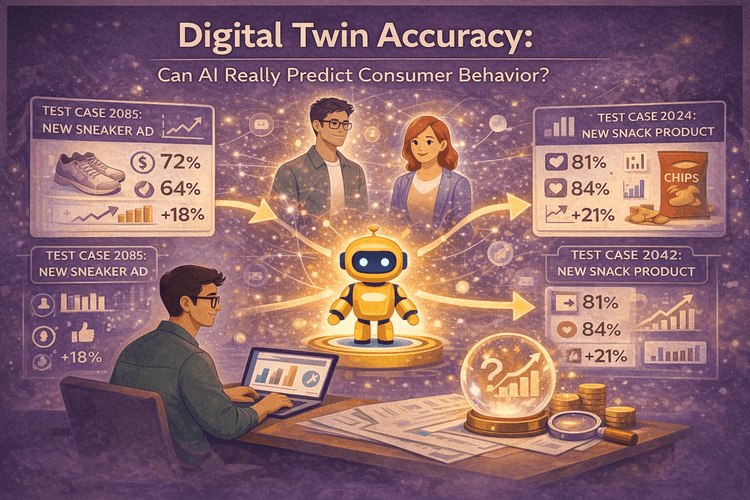
Digital Twin Accuracy: Can AI Really Predict Consumer Behavior? (2026 Benchmark Data)
Nehan Mumtaz

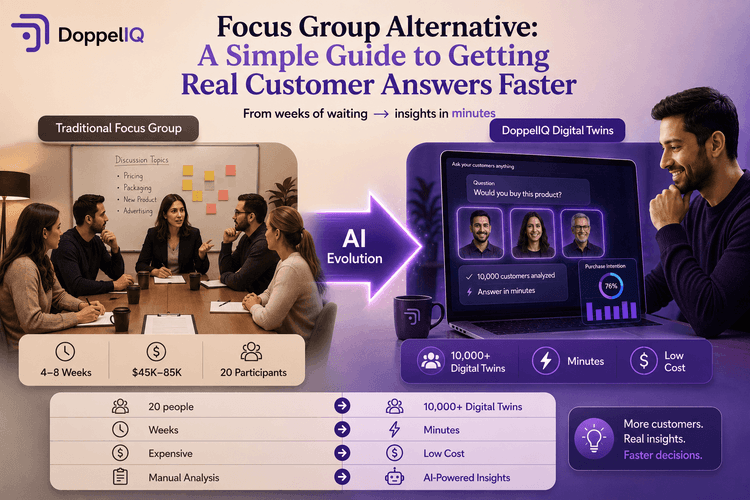
Focus Group Alternative: A Simple Guide to Getting Real Customer Answers Faster
Nehan Mumtaz
Concept Testing Without Surveys: How AI Simulation Unlocks Your Full Product Potential
Nehan Mumtaz


The Enterprise Customer Intelligence Stack in 2026: Beyond Surveys and Dashboards
Nehan Mumtaz
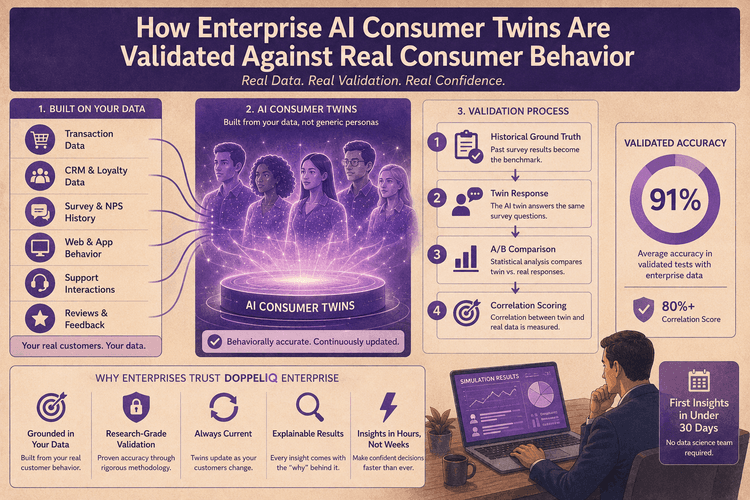
How Enterprise AI Consumer Twins Are Validated Against Real Consumer Behavior
Nehan Mumtaz